Current Team Rankings
Standings
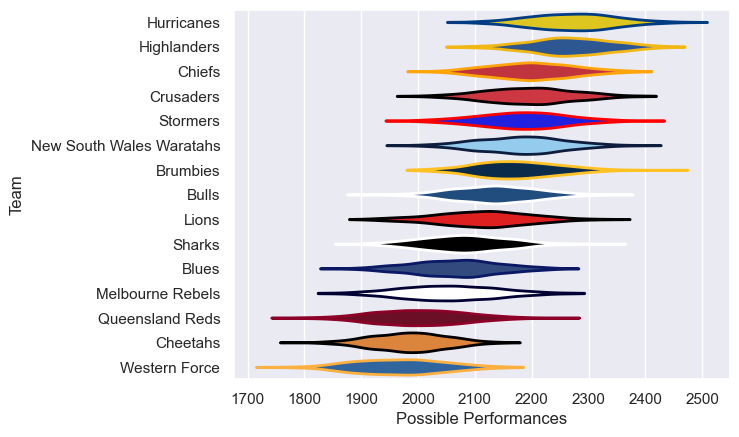
Current Standings
| Club | Played | Wins | Point Differential | Losing Bonus Points | Try Bonus Points | Competition Points |
|---|---|---|---|---|---|---|
| Hurricanes | 18 | 15 | 183 | 2 | 10 | 72 |
| Highlanders | 19 | 14 | 152 | 3 | 7 | 66 |
| Brumbies | 18 | 10 | 108 | 5 | 7 | 52 |
| New South Wales Waratahs | 17 | 11 | 78 | 3 | 5 | 52 |
| Chiefs | 17 | 10 | 63 | 4 | 3 | 47 |
| Stormers | 17 | 10 | 30 | 1 | 2 | 45 |
| Crusaders | 16 | 9 | 143 | 2 | 5 | 43 |
| Lions | 16 | 9 | -22 | 2 | 2 | 42 |
| Bulls | 16 | 7 | 9 | 6 | 3 | 37 |
| Melbourne Rebels | 16 | 7 | -35 | 5 | 3 | 36 |
| Sharks | 16 | 7 | -63 | 3 | 3 | 34 |
| Cheetahs | 16 | 5 | -174 | 2 | 4 | 26 |
| Queensland Reds | 16 | 4 | -187 | 3 | 3 | 22 |
| Blues | 16 | 3 | -146 | 6 | 2 | 20 |
| Western Force | 16 | 3 | -139 | 4 | 3 | 19 |
Completed Match Review
| Model | Percent Correct Predictions | Spread Error |
|---|---|---|
| Club Level | 61.6% | 11.6 |
| Player Level: Lineup | nan% | nan |
| Player Level: Minutes | nan% | nan |